With Week 0 and Week 1 now in the books, the various analytical models now have a sample size (albeit a small one) for each and every FBS team. As you’ll see, things have trended up for Texas Tech in most models after a convincing win over Montana State. Meanwhile, many of their Big 12 foes have taken a step back in the eyes of the analytical models after struggling against inferior competition. It is still very early and these will become more accurate the more samples there are to work with, but let’s dive in.
ESPN’s FPI
FPI ranks all 130 FBS teams based on their FPI score, which is the expected margin of victory over an average opponent on a neutral field. After Week 1, the most average team is Wake Forest, which has a perfectly average FPI of 0.0. Here is how the Big 12 stacks up nationally in FPI, including each team’s chance to win the Big 12 championship.
| Team | National Rank | FPI | Title Odds (%) |
| Oklahoma | 9 | 17.6 | 60.9 |
| Texas | 20 | 11.5 | 18.9 |
| Oklahoma State | 30 | 8.3 | 7.3 |
| Baylor | 37 | 7.1 | 5.8 |
| Iowa State | 40 | 6.4 | 3.4 |
| Texas Tech | 46 | 4.5 | 2 |
| Kansas State | 50 | 2.7 | 1 |
| TCU | 57 | 1.7 | 0.6 |
| West Virginia | 68 | -1.2 | 0.1 |
| Kansas | 112 | -13.1 | 0 |
Oklahoma slipped just a bit from last week, and Texas gained ground on them as a result. Last week, the Big 12 median FPI was 7.3, and this week it is just 5.5. Texas Tech’s FPI fell from 5.1 last week, but is closer to the Big 12 median this week. FPI projects Texas Tech’s season record to be 6.9-5.2.
Below are Texas Tech’s win probabilities against each remaining opponent according to FPI.
| Opponent |
Texas Tech Win Probability (%)
|
| UTEP | 98.1 |
| @ Arizona | 47.8 |
| @ Oklahoma | 12.7 |
| Oklahoma State | 47 |
| @ Baylor | 34.3 |
| Iowa State | 54.1 |
| @ Kansas | 85.5 |
| @ West Virginia | 58.4 |
| TCU | 66.1 |
| Kansas State | 64.1 |
| @ Texas | 23.2 |
Using these odds, we can also calculate the probability that Texas Tech finishes with each remaining possible season record. I’ve listed each one that has more than a 1 percent chance of happening.
| Record | Probability (%) |
| 3-9 | 1.5 |
| 4-8 | 5.4 |
| 5-7 | 12.5 |
| 6-6 | 20.3 |
| 7-5 | 23.6 |
| 8-4 | 19.6 |
| 9-3 | 11.4 |
| 10-2 | 4.4 |
Just like last week, 6 or 7 wins are the most likely outcomes according to FPI. Finishing between 5 and 8 wins has a 76 percent chance of happening according to these odds.
SP+
ESPN’s Bill Connelly produces another analytical model called SP+ (recently re-branded from S&P+, apparently). SP+ is a different model from FPI but its value is the same measurement; it’s the expected margin of victory against an average team on a neutral field. The most average teams in SP+ are BYU and Houston, who come in at SP+ scores of -0.1.
Here is how the Big 12 stacks up nationally in SP+.
| Team | National Rank | SP+ |
| Oklahoma | 8 | 21.5 |
| Texas | 23 | 13.5 |
| Baylor | 28 | 11.4 |
| Texas Tech | 31 | 10.3 |
| Oklahoma State | 33 | 9.4 |
| TCU | 38 | 7.8 |
| Iowa State | 47 | 5.5 |
| Kansas State | 48 | 5.2 |
| West Virginia | 73 | 0.8 |
| Kansas | 108 | -11.6 |
Interestingly, Texas Tech was the biggest mover in SP+ from the Big 12 preseason rankings, increasing 5.5 points from 4.8. Texas Tech was 3.55 points below the median Big 12 SP+ last week, but is now 1.7 points higher than the median. The median stayed mostly the same, moving from 8.35 preseason to 8.6 heading into Week 2.
I also missed this during the preseason, but here is an article that analyzes Matt Wells’ tenure at Utah State in terms of SP+ (spoiler: SP+ thinks Matt Wells is a good coach). I think y’all will enjoy the read. You can also listen to Bill Connelly talk about Matt Wells while he was still at Utah State in this podcast from last October. It’s interesting to go back and hear what he had to say about Wells’ Power 5 prospects. The discussion about Wells is from roughly 29 minutes in until 36 minutes.
Long story short, they chalk up his down years at Utah State (which were still better than Utah State historically performed) to some bad luck and didn’t see a clear Power 5 fit for him. But they opined that if he had another good season or two at Utah State his national profile would increase. I’m liking this hire more and more; you’ve got to find Chris Beard before he becomes Chris Beard, if that makes sense. Texas Tech can hire an up and coming coach from a lower division like they did with Beard and Wells. They probably can’t hire away a guy who is coming off an Elite Eight trip followed by a National Championship game appearance like Beard did the last two years. (And to be clear, Matt Wells has a loooong way to go before he’s in the same conversation as Chris Beard.)
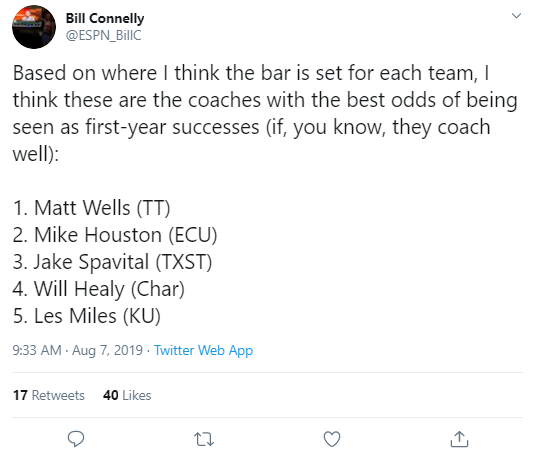
Lastly, I dug up this tweet from Connelly which just further shows his confidence in Matt Wells and his fit at Texas Tech.

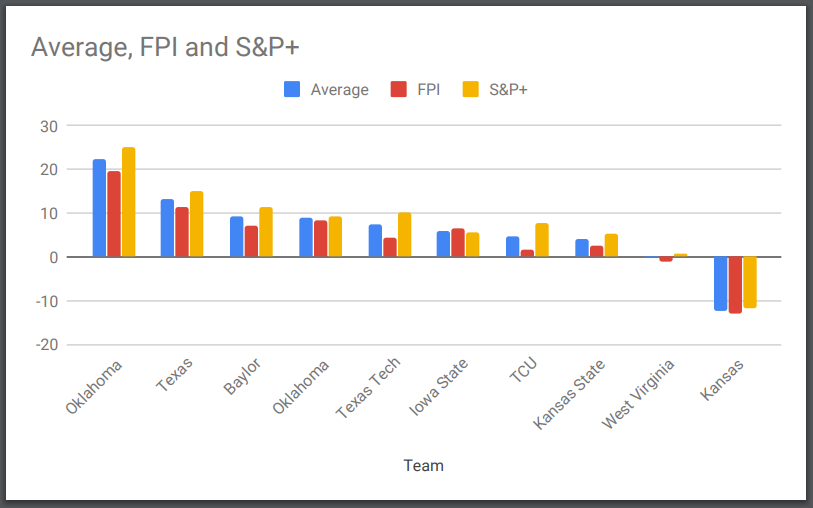
Since FPI and SP+ measure the same thing, I averaged each Big 12 team’s scores between the two models and ranked them accordingly, plotted below. You can also see discrepancies between FPI and SP+ illustrated here.

Adam McClintock
Adam McClintock has his own model which ranks all 130 FBS schools. His complete rankings are behind a paywall on his Patreon site, but he has given me permission to share the Big 12 rankings as they stack up nationally.
| Team | National Rank |
| Oklahoma | 7 |
| Texas | 19 |
| TCU | 20 |
| Oklahoma State | 28 |
| Baylor | 39 |
| West Virginia | 41 |
| Iowa State | 47 |
| Texas Tech | 56 |
| Kansas State | 68 |
| Kansas | 99 |
He also has Texas Tech finishing 4-8 this season. Ouch!
Sagarin
Another model that I found which I didn’t include in preseason is the Sagarin rating system. Unlike FPI and SP+, the rating listed doesn’t correspond to anything concrete like expected margin of victory. It’s just a rating system (it appears to be from 0-100, but Alabama’s rating is 102.62. Maybe they’re so good they broke the model…) that ranks all 130 FBS teams. Here’s how the Big 12 stacks up.
| Team | National Rank | Sagarin |
| Oklahoma | 5 | 91.82 |
| Texas | 13 | 86.01 |
| Oklahoma State | 20 | 82.16 |
| Texas Tech | 33 | 77.5 |
| Iowa State | 34 | 77.29 |
| Kansas State | 37 | 76.74 |
| West Virginia | 38 | 76.39 |
| Baylor | 41 | 76.16 |
| TCU | 49 | 74.6 |
| Kansas | 95 | 63 |
Obviously there are some hardcore discrepancies between these models. Is TCU a top three team in the Big 12 or ninth as Sagarin suggests? Is Texas Tech trending into the top half of the conference or still stuck near the bottom?
I expect the models will gain more of a consensus as time goes on. To help get a consensus now, I added up where each team finishes between 1 and 10 in the Big 12 in each model and then averaged them out. The results are below.
| Team |
Average Big 12 Rank
|
| Oklahoma | 1 |
| Texas | 2 |
| Oklahoma State | 3.75 |
| Baylor | 5 |
| Texas Tech | 5.5 |
| Iowa State | 6 |
| TCU | 6.5 |
| Kansas State | 7.5 |
| West Virginia | 7.75 |
| Kansas | 10 |
All in all, it appears there is quite a bit of parity in the middle of the conference according to all the models, with Oklahoma, Texas, and Kansas firmly cemented at the top and bottom. That could change quickly once Big 12 play arrives and some of these teams start knocking each other off. For now, it looks like the analytics agree that Texas Tech is somewhere in the middle of the pack, potentially with a chance to make a run at the top half of the standings.


