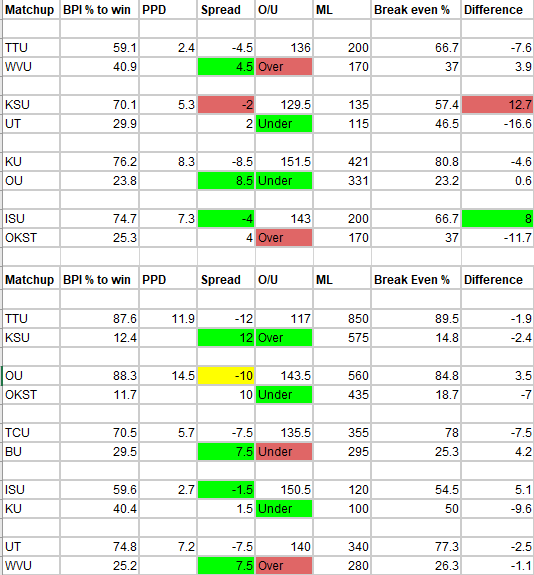
As I mentioned in my introductory piece about sports data, a hobby of mine has been to use that sports data in hypothetical gambling situations to see if I can come out on top in the long run. Many have tried and failed at beating Las Vegas, so I don’t bet any real money. I just track what the hypothetical bets would have paid out or how much the bets would have lost from week to week.
What I did for the first week of Big 12 play and will continue to do for the rest of the season is use BPI to make informed gambling picks. BPI gives a predicted margin of victory for each matchup as well as the probability that each team will win the game straight up. We can use this data to pick against the spread and money lines, respectively.
For the over/under, without any rhyme or reason I am just picking against the public consensus and in favor of the sports books in Las Vegas. I figure they’re not in the business of losing money. So if 80 percent of the money for any given matchup is on the over, I am picking the under. I use the Action Sports Network to access public money trends.
Below is how the system would have played out during last week’s Big 12 matchups. Highlighted in green are winning bets, red are losing bets, and yellow means it was a push. As you can see, the predicted point differential per BPI (PPD) is right next to the spread, and I “picked” accordingly.
The money line portion of the charts probably requires some explanation. What I do is calculate how often a team needs to win the game based on the money line for the bet to break even over time. In other words, if a team has even odds to win a game, I would need them to win half the time to break even. I then compare that to how likely BPI says it is that they’ll win, and either choose to bet the money line or refrain accordingly. A 7 percent margin is usually what triggers a money line bet. So if a team is even odds to win but BPI says they will win 57 percent of the time, I consider that a high value bet.
At +200 odds, I would need a team to win one out of three matchups, or 33 percent of the time. So if they’re at 40 percent to win the game per BPI, I’d bet the money line. You can do the same for money line favorites. If a team is -500, they need to win five out of six (83 percent) of the time for your bet to break even. So at -500, if BPI says that team will win 90 percent of the time, you make the bet. As you’ll see on the charts, there were only two money lines that I calculated to be valuable last week. (All money line favorites should be listed as negatives (i.e. -500), but negative values screw up the formulas in the spreadsheets so they’re listed as positives)

Against the spread picks went 7-1-1, which is really good. At -110, that would have profited $537 if each game were a $100 bet.
Over/under picks 5-4, which is okay. That would have profited $55 total on all $100 bets.
I made two money line bets, Kansas State -135 against Texas, which was a losing bet, and Iowa State -200 against Kansas, which was a winning bet. The Kansas State pick would have lost $100, and the Iowa State game would have profited $50, for a total loss of $50.
All in all, that’s 20 $100 bets for a total risk of $2,000. Total profits would have been $532, entirely attributed to betting against the spread.
Since NCAA basketball lines often don’t come out until the day of a game or maybe the night before, it will be difficult to do much of a gambling preview week to week. But I’ll continue to update this after each week of Big 12 play to see how it does.
Just remember when this goes poorly, none of these are my personal predictions. It’s all based on BPI and public consensus.


