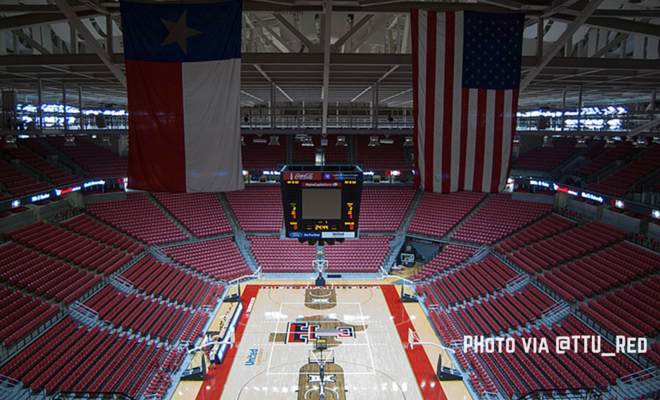
The NCAA released their numbers on attendance (PDF) and Texas Tech basketball averaged 9,026 fans per game last year, which was good for 49th in the nation and # in the Big 12. Here are the entire Big 12 numbers as well as their national ranking.
| Team | National Rank | Average Attendance | Capacity | % Full |
|---|---|---|---|---|
| Kansas | 6 | 16,395 | 16,300 | 101% |
| Iowa State | 16 | 14,275 | 14,356 | 99% |
| Kansas State | 29 | 11,477 | 12,528 | 92% |
| West Virginia | 31 | 11,374 | 14,000 | 81% |
| Texas | 36 | 10,490 | 16,734 | 63% |
| Oklahoma | 48 | 9,296 | 11,528 | 81% |
| Texas Tech | 49 | 9,026 | 15,000 | 60% |
| Oklahoma State | 56 | 8,436 | 13,611 | 62% |
| Baylor | 79 | 6,811 | 10,284 | 66% |
| TCU | 87 | 6,126 | 8,500 | 72% |
Some of these figures are a bit deceiving because a team like Duke is 47th in the nation, averaging 9,314 per game, but a team like Duke cannot fit any more humans into Cameron Indoor Coliseum. I’ve included a percentage of capacity, i.e. how full each program is and Texas Tech obviously has a lot of room to grow.
One other interesting note is that Texas Tech was 26th in the nation in increase for average attendance from the previous year at an average of 742 fans per game, which is really good for Chris Beard and the marketing staff. Other programs on that list was Oklahoma State at #3 with an additional 2,579 fans and TCU with an increase of 812 fans and #22 n the nation.


